Electrophysiology · Cardiovascular
ECG: from the QRS complex and T wave to the QT interval
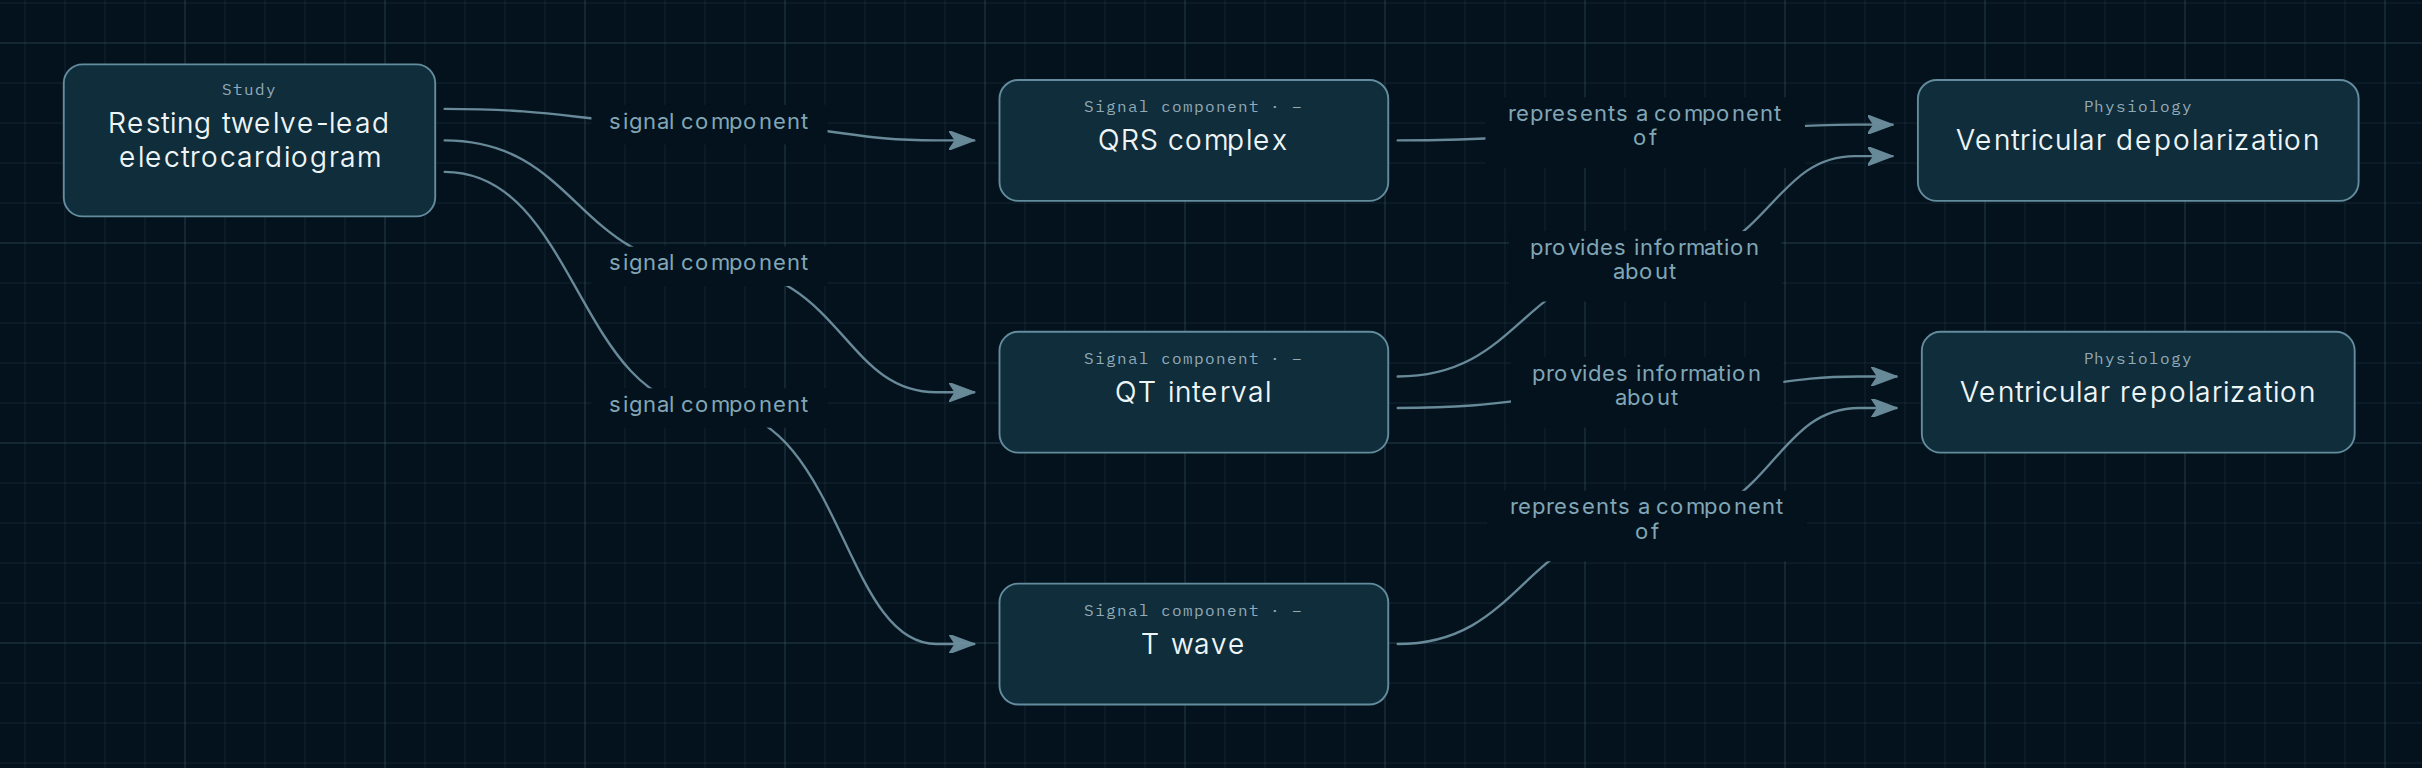
Three ECG components, two electrical processes and one point of convergence: the QT interval. Follow the connections to understand what each component represents and what they share.
Explore this map in the AtlasOpens QRS, QT and T wave with their connections already expanded.
The map
Reading the connections
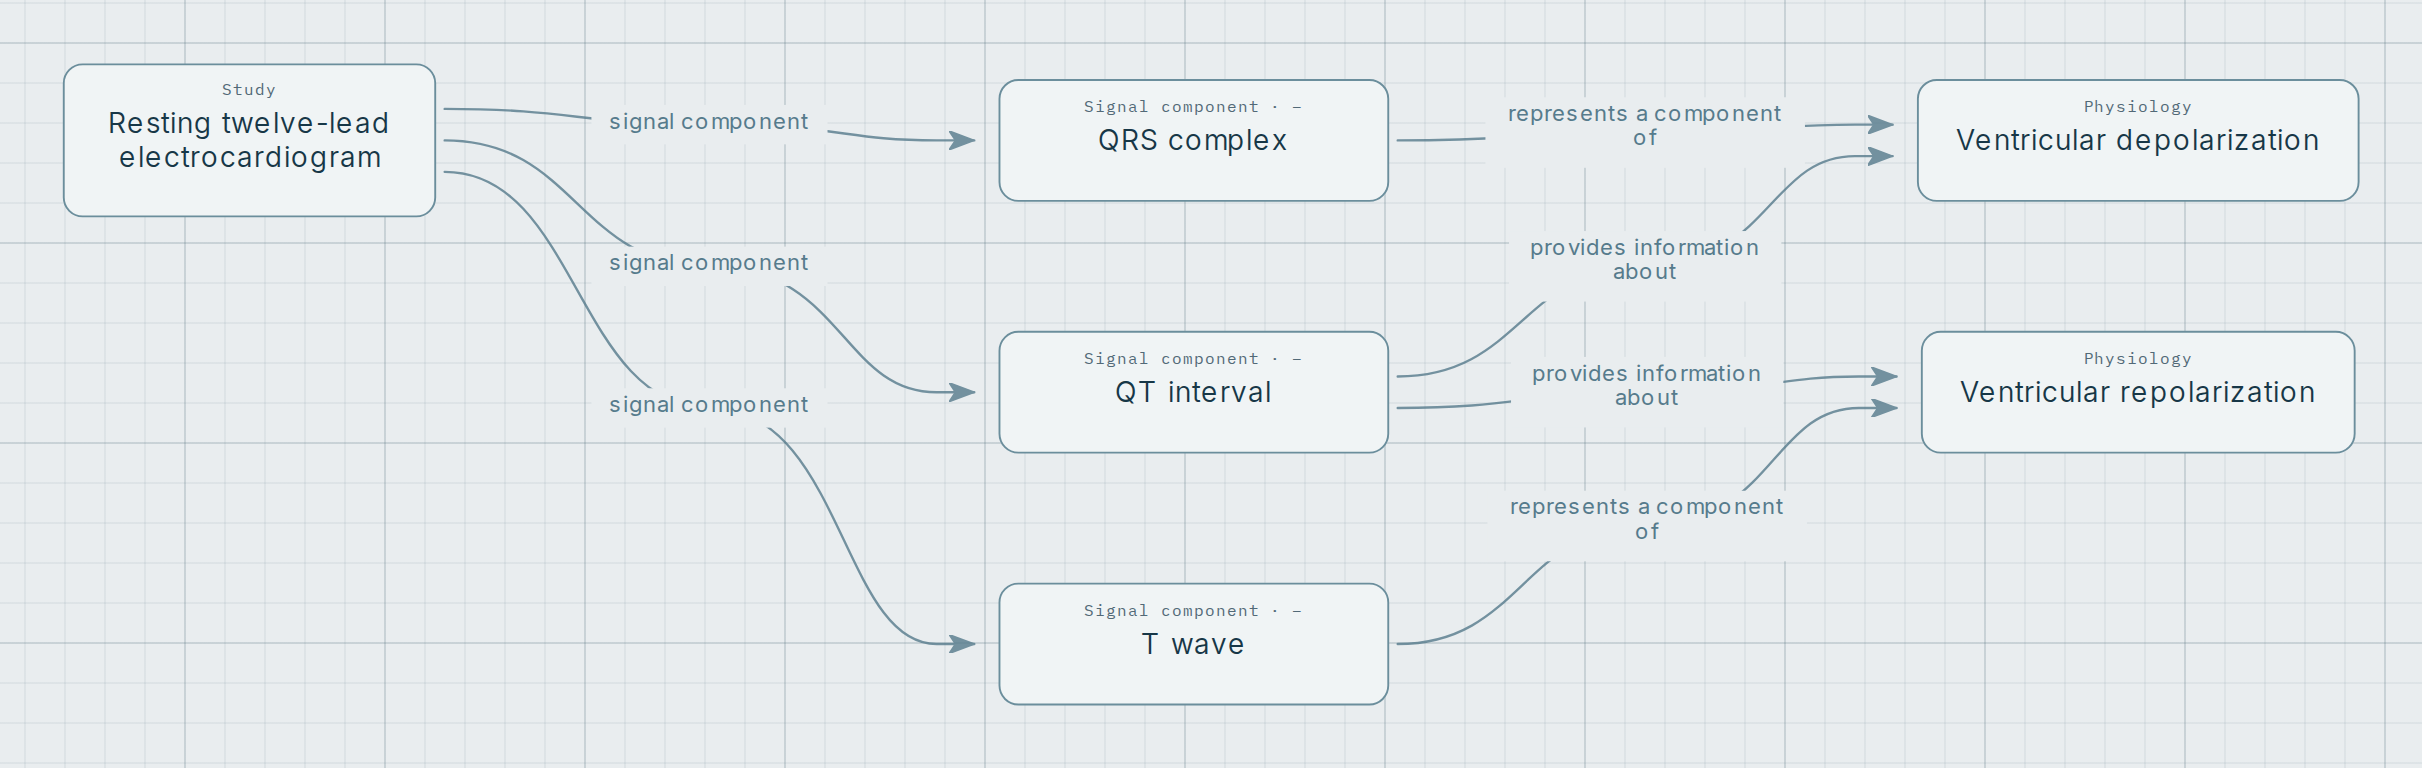
Read the map from left to right. The study groups its signal components; each component then connects to the recorded physiological processes. Arrows express their written relationship: they do not mean that a wave causes the process.
- Represents a component of
- Connects QRS to ventricular depolarization and the T wave to ventricular repolarization.
- Provides information about
- Connects QT to both processes. This interval does not describe repolarization alone.
Three components, two processes
QRS complex
The combined surface expression of ventricular depolarization. Its individual waves may vary by lead; it is not equivalent to mechanical contraction of the heart.
T wave
The surface manifestation of ventricular repolarization. It is not a single cell’s action potential and does not, by itself, identify an exclusive generating region.
QT interval
Extends from the beginning of QRS to the end of the T wave. It includes ventricular depolarization and repolarization; a separate U wave is not part of this interval.
Where the connections meet
QT shares one connection with QRS and another with T through the ventricular processes. The map reveals this integration while keeping the three signal components distinct.
Explore for yourself
- Open the selection and select a component to explore its connections.
- Compare QT with QRS and T: shared processes appear only once.
- Open “Notes and legend” to consult the context and sources for the selected element or relationship.
Opens QRS, QT and T wave with their connections already expanded.
Scope and sources
This selection introduces signal–physiology relationships in the resting adult twelve-lead ECG. It does not show every component, diagnostic criteria, normal ranges or heart-rate correction of QT. It does not interpret an individual ECG or determine clinical management.
References recorded in the nodes and connections of this Atlas selection: